New
York New
York
New
York New
York |
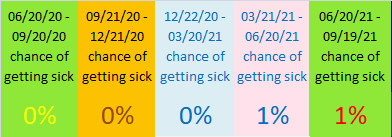
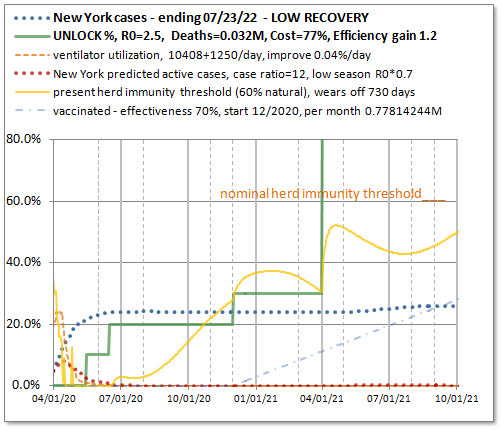
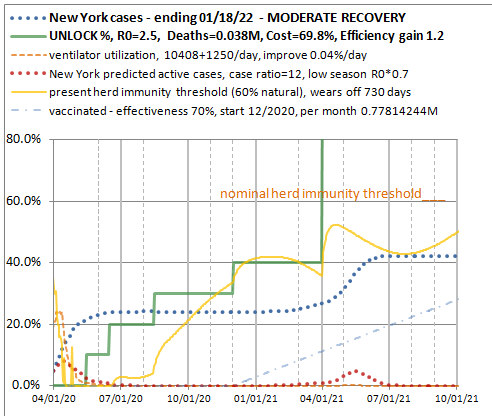
This chart shows the transmission rate. It is quite low and active cases are falling. Note that the data fit the LOW or MODERATE profile since May 15, not the fast profile. 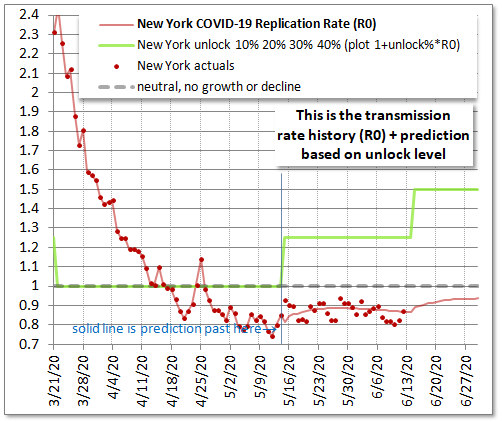 |
This
chart shows the mortality
trend. It is down at a similar rate to hard hit countries.
It
started high and increased a couple of times, and mortality is still
higher in NY than most places. It is advantageous to put off
cases. Whether the trend
continues
is uncertain. But there is room to improve by just matching other
regions, unless climate or demographics are responsible? 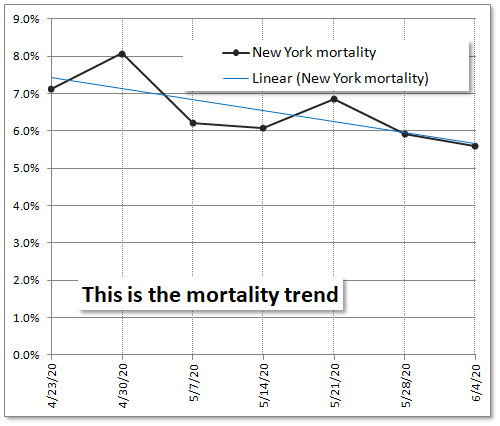 |
|
|
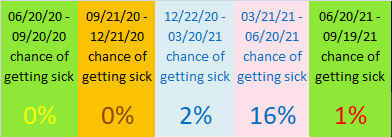
 This
is the fast-recovery option, but for NY it does not mean more people
get sick right away. It means there is a rebound in the middle of
winter. 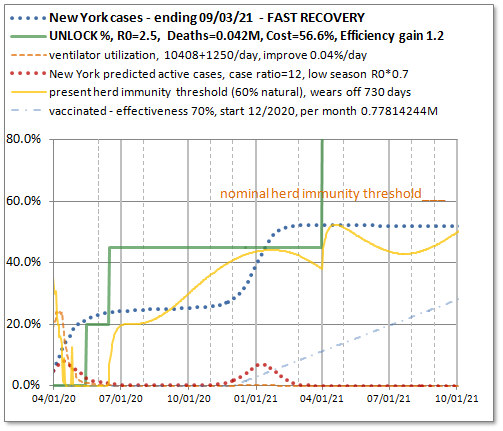
|
This chart is a comparison of economic recovery (on a scale of a percent of one year lockdown costs, green bars) and cost of the pandemic in direct deaths* (as a percent of the highest case, dark bars). No relative comparison is implied at this scale. If a person loses their retirement savings, if ten people lose their retirement savings or small businesses, how many disease deaths is that morally equivalent to? This we feel should be a persona choice, not legislated by government. 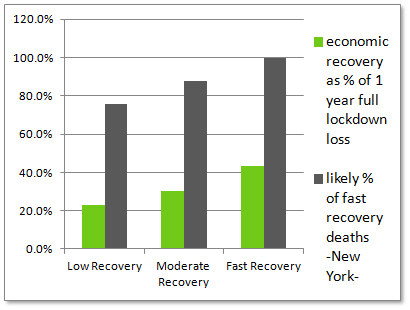 No
inflection point is evident in this chart. The choices are on a
continuum. NY can double their economic recovery for about a 20%
increase in critical cases. Any of the recovery options are
pretty reasonable for NY. Most of its problems are in the
past. It merely needs to be wary of an inadvertent rebound. *
Deaths scale inverse to case
ratio. Case ratio is not well known. Calculations assume 15. |
|
SUMMARY POINTS: The New
York
R0 under lockdown is extremely low, indicating a combination of a very
careful population and significant progress toward herd immunity.
The
sims were run with a case ratio of 12 corresponding to test results
they released nearly a month ago. This corresponds to just over
20% of
the population having had COVID-19, compared to around 2% of the US as
a whole. See details of NY social distancing at right.  With
an increasing herd immunity factor and a seasonal factor around 80% in
the summer (vs. 87% in May), NY can give up half of
its social distancing at no penalty,
keeping R0 below 1.0 and reducing cases. By fall herd immunity
will be enough it can afford some additional unlock for school.
The trick, with such small case numbers and so much herd immunity and
changing seasons, is to avoid overshoot and avoid excessive lockdown
that pushes rebounds into the vaccine period. Vaccination is not
complete until early 2022 in any realistic scenario. These scenarios were the hardest to do
without overshoot and rebound of any I've done so far. But with very careful management NY can
come back to life. Avoiding winter rebound in NY is a bit like avoiding summer rebound in Brazil. |
CASE RATIO, SEASONALITY, SOCIAL DISTANCING,
HERD IMMUNITY AND R0 FOR NY: We
know from the rest of the US that social distancing
alone will knock R0 down to about 1.0. NY was clearly reading
around 0.8 from early to mid May before any unlock. We can
calculate the current R0effective as a product of *
unfettered R0natural (about 2.5, from the start of the R0 tracking
chart 3/21 and prior) R0effective
= R0natural * S * H * D |
How is your country doing? (or any country you are interested in) Is their response effective? Are you in agreement with it? Take our Coronavirus Country Response Satisfaction Survey, just take a couple minutes, one page, using Survey Monkey. Thanks for your feedback! (No contact information will be collected, only general regional information about where responses come from. If you want to contact us, use the contact link on the home page).